
Measuring ROI for Top-of-Funnel Marketing Campaigns

Clicks can show attention, but they don’t prove a campaign is creating value. To calculate ROI as a percentage, subtract campaign costs from campaign-generated sales revenue, divide the result by campaign costs, then multiply by 100. Measuring the ROI of top-of-funnel marketing also means using first-touch attribution to identify campaigns that introduce prospects to your business.
It’s understandable to want a clear return from every marketing dollar, especially when awareness activity can influence a sale long before someone is ready to buy. Assess early engagement alongside later conversions, rather than judging a campaign by its last click alone. This guide explains the ROI formula, the attribution and performance measures that reveal top-of-funnel impact, and how to use the findings to refine channels, budgets and audiences.
Table of Contents
How do you measure ROI for digital marketing campaigns?
Singapore businesses can calculate campaign ROI by subtracting campaign costs from campaign-generated sales revenue, dividing by campaign costs, then multiplying by 100. For top-of-funnel activity, pair this result with first-touch attribution to identify campaigns that introduce prospects.
Linking Customer Activity to Outcomes
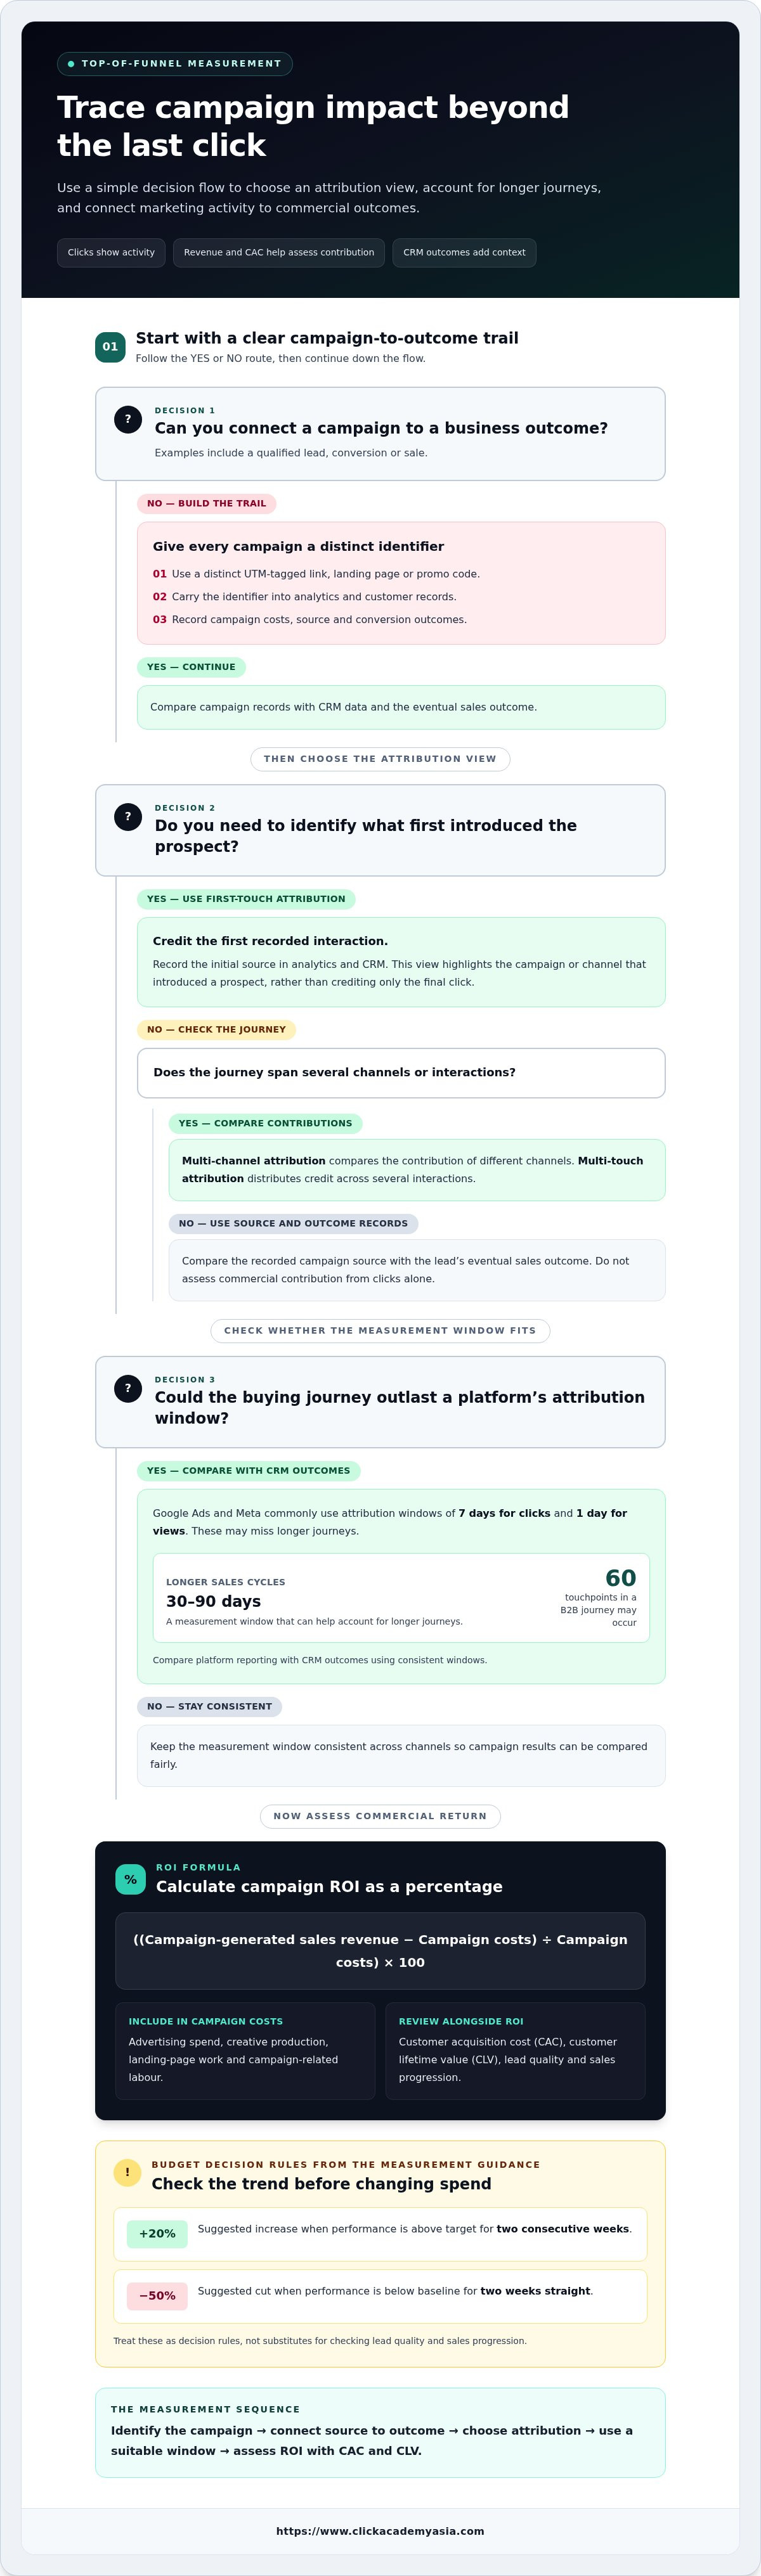
Attribution connects a customer’s marketing interactions with business outcomes, such as a qualified lead, conversion or sale. It matters because clicks and impressions show activity, while revenue and customer acquisition cost (CAC) help assess commercial contribution. Link campaign records with CRM data, then compare each lead’s source with its eventual sales outcome. Include campaign-related costs and track customer lifetime value (CLV) to understand longer-term value. Teams can strengthen this analysis by applying [Internal Link: ClickAcademy Asia Marketing Analytics & Insights] to their reporting practice.
First-Touch Attribution
First-touch attribution assigns credit for a conversion to the first recorded interaction in the customer journey. It helps assess top-of-funnel activity by highlighting the channel or campaign that first introduced a prospect, rather than crediting only the final click. Record the initial source in analytics and CRM systems, then compare results across campaigns. For example, a prospect might discover a brand through a social post, then return through search before converting. First-touch reporting reveals that initial discovery.
Comparing Attribution Approaches
Multi-channel attribution compares the contribution of different channels, while multi-touch attribution distributes credit across several interactions. These views add context to first-touch data, especially in B2B journeys that span weeks or months. A 30- to 90-day measurement window can help account for longer sales cycles. Triangulate findings with multi-touch attribution, marketing mix modelling and incrementality testing. If a channel appears influential across these methods, its contribution is clearer than a last-click report alone suggests.
Revenue Attribution Challenges
Revenue attribution is difficult when purchases follow many interactions, involve several decision-makers or happen outside tracked digital channels. A B2B journey may involve 60 touchpoints, so short reporting windows can miss early discovery. Google Ads and Meta commonly use attribution windows of 7 days for clicks and 1 day for views, which may not capture longer journeys. Privacy changes have also made performance tracking harder from 2018 onward. Singapore teams can compare platform reports with CRM outcomes using consistent windows.
Keep campaign measurement consistent across channels:
Set a campaign goal, such as qualified leads or sales revenue.
Record campaign costs, first-touch source and conversion outcomes.
Compare attribution findings over a suitable sales window.
Review CAC and CLV alongside attributed revenue before reallocating budget.
Campaign-specific promo codes, UTM codes, and landing pages
Campaign identifiers help connect an advertising exposure with the actions and business outcomes that follow. Give each campaign a distinct UTM-tagged link, landing page or promo code, then carry that identifier into your analytics and customer records. This creates a clearer path from campaign investment to lead generation, conversion and revenue.
Use consistent UTM values to distinguish the traffic source, medium and campaign name. For example, label a LinkedIn awareness campaign separately from a search campaign, even if both lead to the same offer. For broadcast or print advertising, use a unique UTM code or web address for each placement. Consistent naming lets the marketing team compare sources without confusing campaign results.
A dedicated landing page makes attribution more reliable. Match its headline and offer to the advertisement, then record meaningful actions such as form submissions or appointment bookings. If the campaign uses a promo code, capture it at checkout or in the lead record. The code can reveal campaign responses that web analytics miss, including customers who return directly instead of clicking the original link.
Set success criteria before launch, based on a business outcome rather than exposure alone. A campaign might aim to generate qualified leads, increase new-customer revenue or support a sales pipeline. Then calculate the measuring roi of top-of-funnel marketing using the campaign’s attributed revenue and complete costs:
ROI percentage: (campaign-generated revenue minus campaign costs) divided by campaign costs, multiplied by 100.
Costs to record: advertising spend, creative production, landing-page work and campaign-related labour.
Outcomes to connect: leads, qualified opportunities, sales and customer value.
For top-of-funnel activity, allow time for early interest to progress into a measurable outcome. Compare campaign cohorts by source and landing page, and review whether leads advance through sales stages. Low immediate sales may reflect a longer buying journey, while strong traffic without qualified responses may signal a mismatch between the audience, message and offer.
Use results to refine one variable at a time, such as the audience, creative or landing-page message. Test a relevant version against the current campaign, then compare qualified outcomes rather than clicks alone. The measurement guidance suggests increasing spend by 20% after two consecutive weeks above target, or cutting spend by 50% after performance falls below baseline for two weeks straight. Treat these as decision rules, not substitutes for checking lead quality and sales progression.
Keep campaigns running when their tracked outcomes support the business goal; fix weak links when traffic fails to convert; and stop activity that persistently misses its target. Teams building a stronger measurement framework can explore ClickAcademy Asia Marketing Analytics & Insights to strengthen campaign evaluation and planning.
What digital marketing metrics can be used as key performance indicators besides ROI?
Useful KPIs show whether top-of-funnel campaigns reach relevant people, earn attention and create qualified interest. SEO and content marketing ROI is best assessed over 6-12 months, while leading indicators can show how audiences respond along the way.
Traffic, Impressions, and Brand Awareness
Traffic, impressions and branded searches help assess whether campaigns are building visibility with the intended audience. Compare website visits by source, new versus returning visitors, and changes in branded search activity during and after a campaign. If impressions rise but relevant visits do not, review audience targeting and creative. If branded searches increase, examine whether they lead to engaged sessions or enquiries, rather than treating awareness as a final business result.
Engagement and Leading Indicators
Engagement metrics reveal how people interact with early-stage content before they are ready to purchase. Track landing-page engagement, content downloads, video completion, email link clicks and return visits. For a campaign promoting a guide, compare downloads with subsequent visits to product or service pages. These indicators help identify which topics sustain interest, while later lead and opportunity data show whether that attention progresses towards conversion.
Sales and Marketing Performance Metrics
Sales and marketing KPIs show whether audience interest develops into pipeline activity. Track lead source, qualified opportunities, lead-to-win conversion rate, deal size and pipeline velocity. In a CRM, review how campaign-sourced opportunities move through each sales stage, then compare their close rates and deal sizes with those from other sources. Professional services teams can also monitor booked appointments and scheduling activity alongside sales volume to assess whether marketing is creating productive conversations.
Avoiding Vanity Metrics and Premature Optimisation
Vanity metrics, such as likes or follower totals, have little value when they aren’t connected to audience quality or business outcomes. Set a measurement chain from reach to engaged visits, qualified leads and sales progression. Review how these indicators relate by campaign and audience. A rise in social activity may show that content resonates, but it matters commercially only if the right people take meaningful next steps.
Use early signals to diagnose performance, not to rush a decision. If traffic grows while engaged sessions decline, check whether the ad promise matches the landing-page content. If engagement is strong but enquiries remain weak, review the next action offered and whether it suits audience intent. Compare performance against the campaign’s own baseline, and allow enough time for the relevant buying journey to develop.
Awareness: impressions, relevant visits and branded searches.
Engagement: content interactions, downloads and return visits.
Progress: qualified opportunities and sales-stage movement.
Business impact: close rates, deal size and booked appointments.
Calculating marketing ROI
Use a consistent formula and include the costs and outcomes tied to the campaign. Distinguish revenue-based ROI from profit-based returns so analytics show whether traffic contributes value after delivery costs. Measuring ROI of top-of-funnel marketing also requires a clear view of which outcomes belong to the campaign.
ROI Calculation Components
Marketing ROI compares a campaign’s return with its investment, using attributed revenue and total campaign costs. Subtract campaign costs from campaign-generated sales revenue, divide by campaign costs, then multiply by 100 for a percentage. For example, enter the revenue and costs from one campaign period into the same calculation. Include media, creative, tools and campaign labour where applicable, so an incomplete cost base doesn’t overstate performance.
Before calculating, define which revenue belongs to the campaign and how attribution assigns credit. Use the same attribution approach, reporting window and cost categories when comparing channels. This makes results more useful for budget decisions than comparing figures built on different assumptions. To measure ROI of top-of-funnel marketing effectively, apply those definitions consistently as early engagement develops into sales.
Revenue and Gross Profit in ROI
Revenue-based ROI uses sales revenue as the return, while gross-profit ROI uses revenue after the direct cost of delivering the product or service. The distinction matters because revenue doesn’t show how much remains to cover marketing and overhead. A campaign with strong sales can look attractive on revenue alone, yet contribute less after fulfilment or production costs are deducted.
For a decision about campaign profitability, calculate both views when direct costs are available. Use revenue-based ROI to compare sales generation, then gross-profit ROI to assess the return after delivery costs. A 5-to-1 ROI ratio is described as a good digital marketing benchmark when the return also covers overhead, but it is not a substitute for your margin calculation. Compare like with like across campaigns and periods.
Keep the measurement inputs consistent:
Return: use campaign-generated sales revenue, or gross profit when evaluating profitability.
Investment: count all campaign-related costs, not just advertising spend.
Attribution: apply one defined method for linking outcomes to campaign activity.
Timeframe: review delayed conversions alongside immediate results.
For example, if a campaign brings in new customers who make repeat purchases, a short reporting window may miss later value. Track customer lifetime value alongside initial revenue, and separate observed sales from incremental results where possible. This helps distinguish a campaign that captures existing demand from one that creates additional business.
Use the calculation as a decision tool, not a standalone verdict. A positive revenue-based result may still fail to cover direct costs; a lower early return may reflect a longer buying journey. Compare ROI with conversion rate, customer acquisition cost and sales progression before adjusting the strategy. Consistent inputs make those comparisons more reliable and give teams a clearer basis for refining investment.
Optimising platforms, budgets and audiences using measurement data
Budget decisions improve when channel results use consistent definitions, timeframes and business outcomes. Bring campaign and sales data together before comparing platforms or shifting investment.
Aggregating Cross-Channel Data
Cross-channel aggregation combines campaign, website and sales information in a shared reporting view. It helps teams compare marketing efforts using actual outcomes rather than separate platform averages. Align campaign names, dates and conversion definitions across advertising platforms, analytics and CRM records. Then compare reach and lead quality with sales progression. Keep the data foundation privacy-first by collecting only information needed for analysis and using it responsibly.
A shared dashboard should distinguish platform-reported results from CRM outcomes. For example, one channel may report clicks while another reports leads, making direct comparison misleading. Standardise the reporting period and outcome definitions, then identify each metric’s source. This gives decision-makers context for channel performance without implying that every conversion belongs to one platform.
Fragmented Marketing Data
Fragmented data sits in separate systems that use different identifiers, formats or reporting windows. The average marketing team runs 19 point-solution tools across its stack, which can make a full customer journey difficult to assemble. When records do not connect, teams may double-count leads, miss assisted conversions or compare incompatible results. Map the systems feeding each report, then resolve naming and data-quality gaps before interpreting trends.
Start with a small, reliable dataset: campaign source, audience, interaction, lead status and sales outcome. Define who maintains each field and how often it is reviewed. Avoid copying unnecessary personal details into reporting dashboards. A consistent, limited dataset can make cross-channel decisions clearer and reduce reliance on disconnected platform reports.
Allocating Budgets with Data
Data-led allocation shifts investment towards channels and audiences that support defined business goals. Compare qualified leads, opportunity progression and customer value, not reach alone. Separate established performance from tests, so a new audience is not judged against a mature campaign without context. Review audience segments to see which generate relevant engagement and advance through the sales process.
Use decision rules, but apply them to a stable baseline and suitable measurement window. One recommendation is to increase campaign spend by 20% after two consecutive weeks above target. Another is to cut spend by 50% if performance falls below baseline for two weeks straight. Before acting, review lead quality, tracking changes and sales-stage outcomes. This helps prevent short-term fluctuations from driving budget shifts.
For practical capability in analytics-led planning, explore digital marketing strategy training.
ClickAcademy Asia: WSQ Digital Marketing Strategy & Planning
ClickAcademy Asia helps marketing professionals build the strategic skills to connect campaign activity with measurable business outcomes through its WSQ Digital Marketing Strategy & Planning course. It’s a relevant next step when your team needs a clearer approach to setting objectives, evaluating channels and using performance data to guide decisions.
For more focused development, WSQ Content Marketing Strategy, WSQ Search Engine Optimization (SEO) and WSQ Search Engine Marketing (SEM) cover key areas of top-of-funnel planning and execution. Strengthening these capabilities helps marketers assess how campaigns attract audiences and contribute to the wider customer journey.
To explore the training options, visit ClickAcademy Asia.
Make measurement part of your team’s next move
The next step is to make measurement a shared working habit. Agree on what counts as a qualified outcome, keep campaign definitions consistent, and give marketing and sales teams a common view of performance. That foundation helps turn learning from each campaign into clearer decisions for the next one.
Building capability in measuring ROI of top-of-funnel marketing can help teams connect strategic planning with practical channel choices. ClickAcademy Asia offers WSQ Digital Marketing Strategy & Planning, WSQ Content Marketing Strategy and WSQ Search Engine Optimization (SEO) to support professionals developing these skills.
Contact ClickAcademy Asia today to explore the next step for your learning or team development. With a stronger measurement mindset, your team can keep improving its marketing decisions with purpose and confidence.
Frequently Asked Questions
How do you calculate ROI?
Calculate ROI by subtracting campaign costs from campaign-generated revenue, dividing the difference by those costs, then multiplying by 100. Before comparing results, define the reporting period and which sales count as campaign-generated. Use consistent attribution and cost rules across campaigns. A negative percentage means measured revenue did not cover the campaign costs, while a positive result still needs context from margins and customer value.
What is ROI in marketing, and why is it so hard to prove?
Marketing ROI measures the return associated with marketing activity relative to its investment. It’s difficult to prove because a sale may follow several channels, offline conversations and other influences, while tracking systems record only part of that journey. A useful test is to compare campaign outcomes with a suitable baseline or holdout group. This helps distinguish activity that coincided with sales from activity that contributed incremental results.
Why is marketing ROI important?
Marketing ROI helps leaders assess whether investment contributes to business outcomes and where resources may be better allocated. It gives finance, sales and marketing a shared basis for discussing results, rather than relying only on reach or clicks. Use it alongside profit margin, customer lifetime value and acquisition cost. This broader view helps a team avoid cutting an awareness campaign simply because it hasn’t generated immediate sales.
How Do You Track ROI Simply?
Start with a single campaign and record its objective, spend, source and resulting leads or sales in one reporting sheet. Use a consistent campaign name across analytics and CRM records, then update lead status as sales progress. Review the same reporting period each time and separate direct responses from assisted activity. This lightweight process helps a smaller Singapore marketing team identify data gaps before investing in more complex reporting.
How Should Supporting Metrics Roll Up?
Group supporting metrics by their role in the customer journey: reach, engagement, qualified demand, pipeline and revenue. Each operational metric should explain a movement in the next stage, such as content engagement leading to a sales-qualified opportunity. Share detailed campaign indicators with the marketing team, then report pipeline and revenue outcomes to executives. Executive-level marketing metrics can be reviewed monthly or quarterly, while operational measures may need weekly attention.
What Does “Good” Look Like by Channel?
Good performance depends on the channel’s objective and audience, so compare like with like. Typical LinkedIn paid social click-through rates for B2B audiences are 0.5-1.5%, while Facebook’s are 1-3%. B2B email open rates are typically 15-25%. Treat these as directional benchmarks, not ROI targets: assess whether channel activity generates qualified leads and contributes to pipeline, then compare its results with your own baseline.
What does ROI mean for top-of-funnel marketing?
For top-of-funnel marketing, ROI is the business value associated with activities that introduce potential buyers to a brand. That value may appear later, so assess whether the campaign creates incremental awareness, qualified interest or pipeline, not just immediate purchases. For example, compare exposed and unexposed audience groups where practical. This can reveal whether an awareness campaign contributes demand that last-click reporting might miss.
Which KPIs measure top-of-funnel marketing performance?
Useful top-of-funnel KPIs include relevant reach, impressions, website visits, branded search activity, content engagement and new leads. Choose measures that fit the campaign: a thought-leadership campaign may prioritise engaged readers, while a demand-generation campaign may track qualified enquiries. Then connect those indicators with lead progression and opportunity outcomes. This keeps a dashboard focused on whether activity attracts the right audience, rather than simply increasing volume.



Comments