
Marketing Attribution Modeling in Singapore: Compare Ad Models

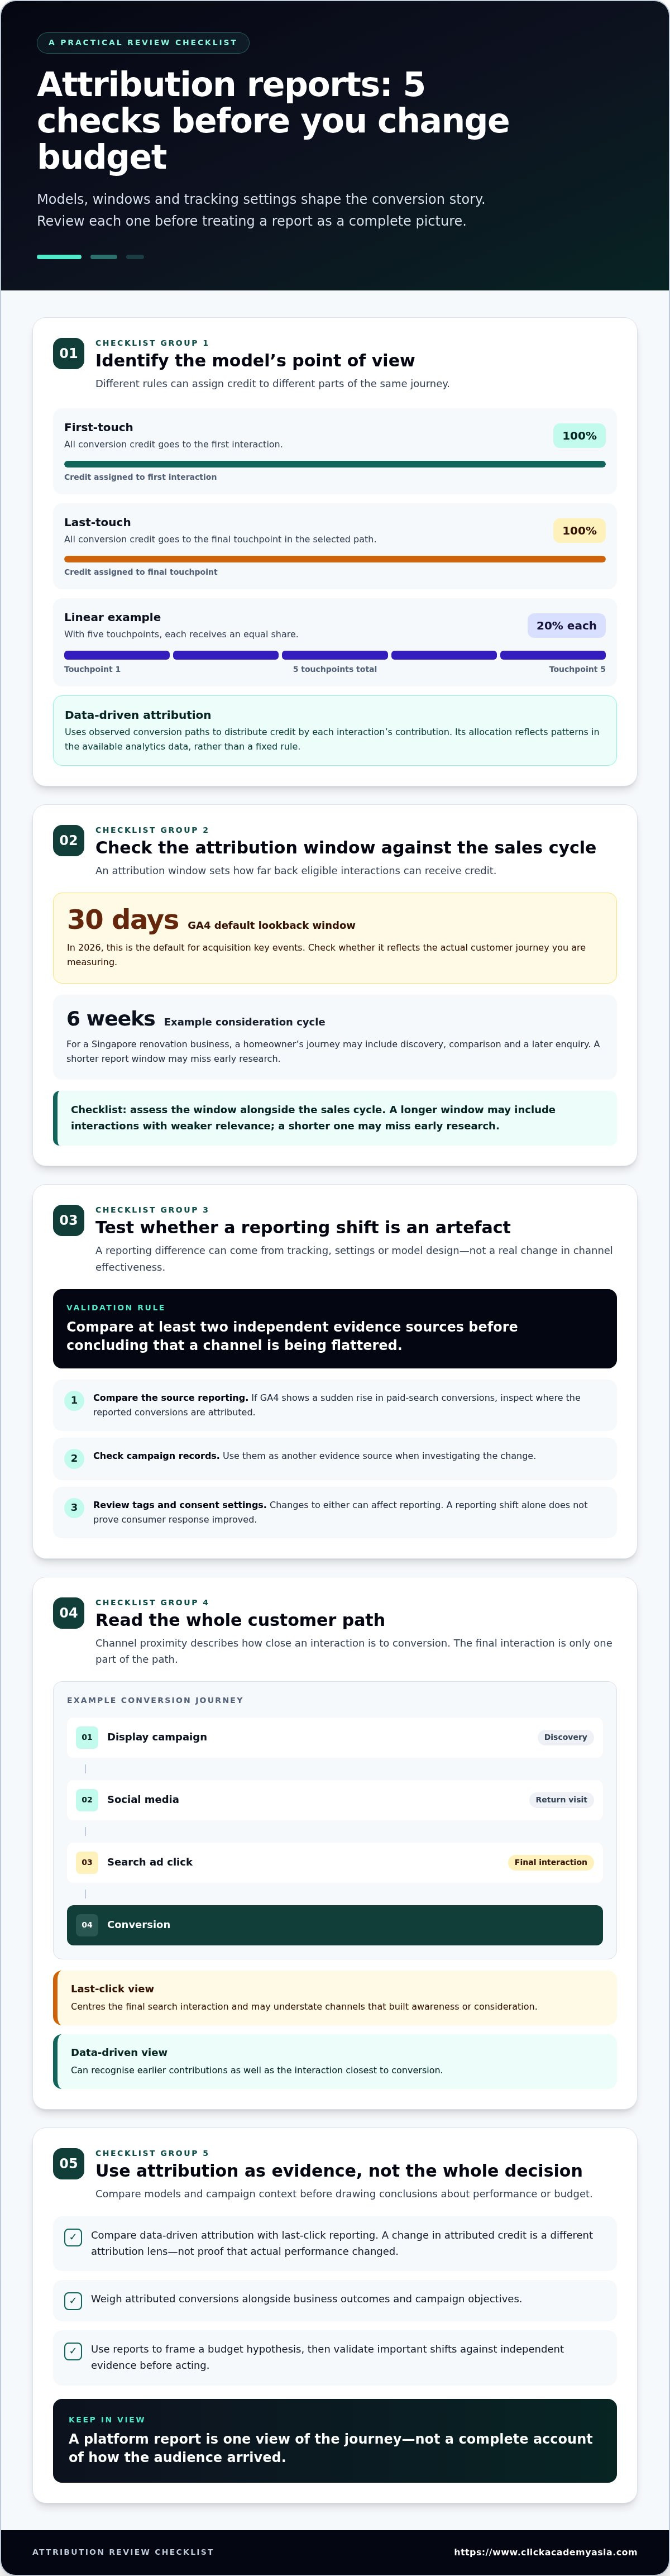
Marketing attribution modelling assigns conversion credit to the interactions that contributed to a sale or another outcome. The models differ in how they distribute that credit: first-touch gives 100% to the first interaction, while a linear model gives each of five touchpoints 20%. A marketing attribution modeling course in Singapore should help you understand what those differences mean for campaign decisions.
When comparing campaign results across platforms, it’s easy to assume that every report tells the same story. But the attribution model matters: it can change which channels appear to contribute most and how you interpret performance.
This guide explains how common attribution models work and compares the options available in Google Ads, GA4 and Meta. You’ll also see how to use those reports as evidence for better budget and measurement decisions, rather than treating any single model as the complete picture.
Table of Contents
Data-driven attribution and last-click reporting
Last-click reporting gives the final qualifying interaction credit, while data-driven attribution assesses how interactions contribute across a conversion path. This distinction matters because the model can change which campaigns appear to support your goals.
In 2026, GA4’s default lookback window for acquisition key events is 30 days. A longer consideration cycle may require a window that better reflects the actual customer journey.
To understand how attribution connects customer interactions to outcomes, watch this explainer from HubSpot Marketing:
First-Touch and Last-Touch Credit
First-touch attribution assigns 100% of conversion credit to the customer’s first interaction, while last-touch attribution gives it to the final interaction. These single-touch models answer different questions: first-touch highlights discovery, whereas last-touch shows what immediately preceded conversion. Compare them when assessing whether an audience first encountered your brand through awareness activity or returned through a later campaign.
First-Click and Last-Click Reporting
First-click reporting credits the first recorded ad click, while last-click reporting credits the final recorded ad click before conversion. Click-based reporting focuses on paid clicks; first-touch and last-touch can refer more broadly to interactions included in a model. For example, a social ad click may introduce a prospect, while a later search click receives last-click credit.
Last-touch attribution, or LTA, assigns conversion credit to the final touchpoint in the selected path. It’s easy to interpret, but can understate earlier channels that built awareness or consideration. Treat the result as a view of the closing interaction, not a complete account of how the audience arrived.
Data-driven attribution uses observed conversion paths to distribute credit according to each interaction’s contribution. Unlike a fixed rule, its allocation reflects patterns in the available analytics data. Compare its results with last-click reporting: if a channel gains credit under one model, that signals a different attribution lens, not proof that actual performance changed.
For example, a customer may discover a brand through display, return through social media, then convert after clicking a search ad. Last-click centres the final search interaction; data-driven attribution can recognise earlier contributions. Review the path, conversion window and campaign context before using either view to adjust the budget.
Choose a course that matches your analytics experience and career goals. If you manage campaigns, prioritise interpreting attribution models; if you lead strategy, focus on measurement and budget decisions.
Singapore courses qualify for SkillsFuture Credit or other funding only when the specific course meets the relevant scheme’s eligibility criteria. Course titles alone don’t establish eligibility.
Course costs depend on the provider, duration, delivery format and depth of coverage; fees are provided after a quote request.
Course duration, schedule and prerequisites depend on the curriculum and delivery format. Before enrolling, compare the stated learning outcomes with your current skills and the time you can commit to study.
What is attribution modeling?
Attribution modeling assigns conversion credit to marketing interactions, helping teams assess how campaigns contribute across channels. In Singapore, a key question is whether a reported result reflects consumer behaviour or a measurement effect.
GA4 uses a default 30-day lookback window for acquisition key events. The right interpretation also depends on the sales cycle, channel roles and quality of tracking.
Measurement Artefacts and Channel Effectiveness
A measurement artefact is a reporting difference caused by tracking, settings or model design, rather than a real change in channel effectiveness. Distinguishing the two matters: decisions based on distorted figures can favour the wrong campaigns.
Compare at least two independent evidence sources before concluding that a channel is being flattered. For example, if GA4 shows a sudden rise in paid-search conversions, compare its source reporting with campaign records and changes to tags or consent settings. A reporting shift alone doesn’t prove that consumer response improved.
Attribution Windows and Channel Proximity
An attribution window sets how far back eligible interactions can receive credit, while channel proximity describes how close an interaction is to conversion. Assess both against the sales cycle. A short window may miss early research for a considered purchase, while a long one may include interactions with weaker relevance.
For a Singapore renovation business, a six-week consideration cycle can include discovery, comparison and a later enquiry. A homeowner who first sees a campaign well before signing may disappear from a shorter report. Align the window with that journey, then compare how credit changes across channels.
GA4 acquisition reports organise traffic by channel and source, helping analysts see where sessions originate. An AI assistant can help users explore or summarise reporting, but it doesn’t replace the attribution model or its settings. Check the selected model and reporting scope before treating an assistant’s summary as a performance conclusion.
Cross-channel budget allocation should weigh attributed conversions alongside business outcomes and campaign objectives. If branded search gets most of the last-touch credit, that doesn’t show whether display or social media created earlier demand. Use reports to frame a budget hypothesis, then assess it against independent evidence before shifting spend.
Consider a consumer who sees a display campaign, returns through social media, then searches for a brand before converting. Source reporting identifies those visits, while the attribution model determines how conversion credit is distributed. Comparing the path with campaign timing helps distinguish a channel that introduced the brand from one that captured existing intent.
Singapore learning options include marketing analytics and GA4-focused courses. Course content and delivery formats vary, so compare the stated learning outcomes with your role and goals.
Useful course assessments may involve interpreting campaign data, comparing attribution views and explaining a budget recommendation. Look for learning activities that connect a reporting observation to a reasoned marketing decision.
To strengthen the skills behind these decisions, explore practical marketing analytics learning alongside your team’s reporting needs.
Linear attribution
Linear attribution divides conversion credit equally among the touchpoints recorded in a customer’s journey. In a five-touchpoint example, each channel receives 20% of the credit. This multi-touch approach gives discovery, consideration and conversion interactions a place in the same report.
Imagine a consumer who first sees a display ad, reads a blog article, engages with a social post, searches for the brand, then converts. Linear attribution assigns equal credit to each interaction. This helps teams assess activity across the funnel rather than focusing only on the final campaign.
Linear attribution’s main strength is consistency: each recorded touchpoint receives an equal share, regardless of channel or timing. Marketers can compare the display ad, article, social post and search campaign within one framework. This is useful when assessing how several channels appear together in a conversion path.
Equal credit doesn’t mean equal influence. In the scenario above, search may have captured strong intent, while the first display impression introduced the brand. Linear attribution doesn’t distinguish these roles. Use the report to understand participation, not as proof that every touchpoint contributed equally.
Linear multi-touch attribution can support campaign planning when a business wants to recognise interactions throughout the journey. For example, a content team can see that an article appears in converting paths, even when it isn’t the final interaction. Pair that observation with campaign objectives and other performance evidence before changing channel investment.
Time-decay attribution also shares credit across multiple interactions, but gives more weight to touchpoints closer to conversion. Linear attribution treats an early discovery interaction and a later search click equally; time-decay gives the later interaction more credit. This distinction matters when a team wants reporting to reflect timing rather than equal participation.
Choose a model based on the decision you need to make. If you’re assessing whether several funnel stages appear in successful journeys, linear reporting offers a simple comparison. If timing matters more, time-decay provides a different view. Keep the model consistent when comparing campaigns, or changes may reflect the attribution rule rather than campaign outcomes.
To optimise, review the paths behind reported credit, then check whether each channel supports its intended role. A content campaign may build awareness, while branded search captures demand later. Linear attribution makes both visible in the same journey, offering a starting point for discussion, not a standalone budget instruction.
Algorithmic and data-driven attribution
Algorithmic attribution uses observed journey data to estimate how interactions contribute to a conversion. Data-driven attribution is a platform’s modelled approach: it distributes fractional credit across touchpoints, with the total adding up to 100%. Unlike fixed rules, its allocation can reflect patterns in available data. Treat the result as an analytical estimate, not a direct record of every influence on revenue.
For example, a consumer might see a social campaign, visit through organic search, then convert after clicking a paid-search ad. A data-driven model can distribute credit across that journey rather than assigning everything to one touchpoint. The result helps compare strategies, but depends on the interactions the platform can observe and the model can use.
Data gaps can distort comparisons. A campaign may appear to contribute less if its interactions aren’t recorded consistently or a platform’s modelling changes. Re-tagging a website or app can also alter reported paths. When conversion figures shift, compare tracking changes, platform settings and campaign activity before interpreting the difference as a change in effectiveness.
Privacy choices also affect journey data. Singapore's PDPC guidelines, revised in May 2024, require consent for cookies used to target advertising. Consent rates can change how much activity appears in reports, so record those changes alongside campaign results. A thinner observed journey does not necessarily mean consumers stopped interacting with a channel.
Access should match the reporting task. A marketing analyst may need campaign and conversion-path data to investigate attribution, while a leadership review may need aggregated channel findings. In either case, define who uses the data and which decision it supports. This helps ensure individual journey details aren’t shared more widely than the analysis requires.
Review attribution again when consent rates change, a platform updates its modelling, a site or app is re-tagged, or the purchase cycle shifts. These events can affect how journeys appear before they change actual demand. Annual reviews alone may miss important changes between review dates.
Keep a short change log for each analysis: note the model, conversion window, tracking updates and relevant privacy changes. Then compare the result with another independent evidence source, such as campaign records or sales outcomes. If GA4 attributes more conversions to a channel after a modelling change, check whether the evidence supports that interpretation before adjusting budgets.
Algorithmic attribution is most useful when teams understand its inputs and limits. Apply it to a clear question, such as whether an awareness campaign appears in converting journeys, then assess the result alongside business outcomes. This helps marketers use modelled credit to inform decisions without treating it as a complete explanation of every conversion.
Attribution model options in Google Ads, GA4 and Meta
Google Ads, GA4 and Meta each report campaign performance through their own measurement lens. Compare model settings and reporting scope before using conversion credit to guide a purchase or budget decision.
Platform Attribution Model Options
Platform attribution options define how conversion credit is assigned to interactions within that platform’s reporting. This matters because Google Ads, GA4 and Meta can present different views of the same customer journey.
Google Ads and Meta reports should be read alongside their selected attribution settings, not as interchangeable totals. In GA4, the conversion paths report helps examine interactions leading to key events. Heuristic and algorithmic multi-touch models divide credit fractionally, with each journey’s credit adding up to 100%.
Two useful reference models are U-shaped and W-shaped attribution. A U-shaped model assigns 40% to the first touchpoint and 40% to the last, then shares the remaining 20% evenly among middle interactions. A W-shaped model typically gives 30% each to the first touchpoint, lead creation and opportunity creation, then distributes the remaining 10% across other interactions.
Course Coverage of Analytics Platforms
Courses covering multi-touch attribution, GA4 and marketing analytics help learners interpret platform reports and explain their implications. This matters when a marketer must compare credit across channels or present a campaign decision to colleagues.
In Singapore, look for learning that combines GA4 reporting with attribution concepts and practical campaign analysis. A useful exercise might compare a conversion path in GA4 with platform-reported campaign results, then explain why the figures differ. That builds judgment beyond memorising model names.
For a fair comparison, define the conversion, reporting period and attribution settings first. Then review the same campaign outcome across Google Ads, GA4 and Meta, noting whether each report covers platform activity or a broader journey. Different scopes can produce different totals without showing that one platform measured the purchase inaccurately.
Use the model that fits the question. A last-click view shows which interaction closed a conversion, while U-shaped credit highlights discovery and the final touchpoint. W-shaped reporting can help teams examine lead and opportunity milestones. These models describe how credit is allocated, not proof that a channel independently caused revenue.
Before reallocating spend, compare platform results with business outcomes and campaign records. If Meta reports a conversion while GA4 presents a different path, inspect settings and the event being counted. Keep the definitions consistent between reports, then document the reason for any budget change.
For marketers building platform confidence, explore practical analytics learning that connects GA4 reporting with campaign decisions.
ClickAcademy Asia: WSQ Digital Marketing Strategy & Planning
ClickAcademy Asia’s WSQ Digital Marketing Strategy & Planning helps professionals connect campaign measurement with broader marketing decisions. Choose this programme when you need to assess channel performance, set objectives and plan how campaigns support business goals.
For more focused learning, WSQ Search Engine Marketing (SEM), WSQ Search Engine Optimization (SEO) and WSQ Content Marketing Strategy address distinct parts of digital campaign planning. Choose according to your role, from evaluating paid search activity to aligning content with marketing objectives.
Build your team’s confidence in turning attribution reports into considered plans. Contact ClickAcademy Asia to discuss your learning needs.
Build a stronger measurement practice
Attribution skills are most valuable when your team can turn reporting into clear decisions and apply those lessons to future campaigns. A marketing attribution modeling course in Singapore can help professionals build confidence in their measurement approach.
ClickAcademy Asia offers WSQ Digital Marketing Strategy & Planning, WSQ Content Marketing Strategy and WSQ Search Engine Optimization (SEO). These courses help your team develop skills in marketing planning, content and search.
Equip your team with relevant WSQ-funded training tracks to support ongoing professional development. Contact ClickAcademy Asia to explore training for your team.
Develop your team’s skills so they can bring greater clarity and purpose to their work.
Frequently Asked Questions
Do first click, linear and time decay models still exist?
Yes. First-click, linear and time-decay remain useful attribution approaches, although platform availability can vary. They answer different questions: first-click highlights discovery, linear gives equal credit to all recorded touchpoints, and time-decay gives more weight to interactions closer to conversion. Use them to compare perspectives on a journey rather than assuming every advertising or analytics platform offers each model as a selectable setting.
How do I know which channel really caused a sale?
Attribution reports show recorded interactions, but don’t prove that one channel alone caused a sale. Compare campaign data with sales outcomes and other independent evidence. For example, a controlled holdout can help assess whether sales change when a campaign is withheld from a comparable audience. Also review tracking changes and channel roles before treating an increase in attributed conversions as incremental impact.
What is marketing attribution?
Marketing attribution assesses how campaign interactions relate to a conversion, such as a purchase or enquiry. A consumer might discover a brand through social media, read an article, then return through search. Attribution helps marketers examine those touchpoints and make more informed planning decisions. It’s a measurement framework, not a guarantee that a reported interaction independently caused the outcome.
Which Singapore institutions or providers offer marketing attribution training?
In Singapore, ClickAcademy Asia offers WSQ Marketing Analytics & Insights, Google Analytics (GA4) Training and WSQ Digital Marketing Strategy & Planning. Contact TeamSG@clickacademyasia.com or WhatsApp/phone 9388 8755 for course details. Eligibility requires age 21 years and above, Level 2 basic computer literacy, minimum GCE N, O, or A Level, NITEC, or a diploma plus 2 years work experience, the stated English proficiency thresholds, and bringing a personal laptop.
Which tools and platforms are taught, such as Google Analytics 4, Adobe Analytics, or attribution software?
ClickAcademy Asia’s named platform training includes Google Analytics (GA4) Training and Google Ads Search, Display and Video Certification. These options focus on Google’s analytics and advertising tools. For a course involving attribution, check how its learning outcomes relate to your work, such as interpreting conversion paths or comparing platform reports. That helps you distinguish general attribution knowledge from hands-on instruction in a specific tool.



Comments