
Calculating MarTech ROI by Including Every Marketing Cost

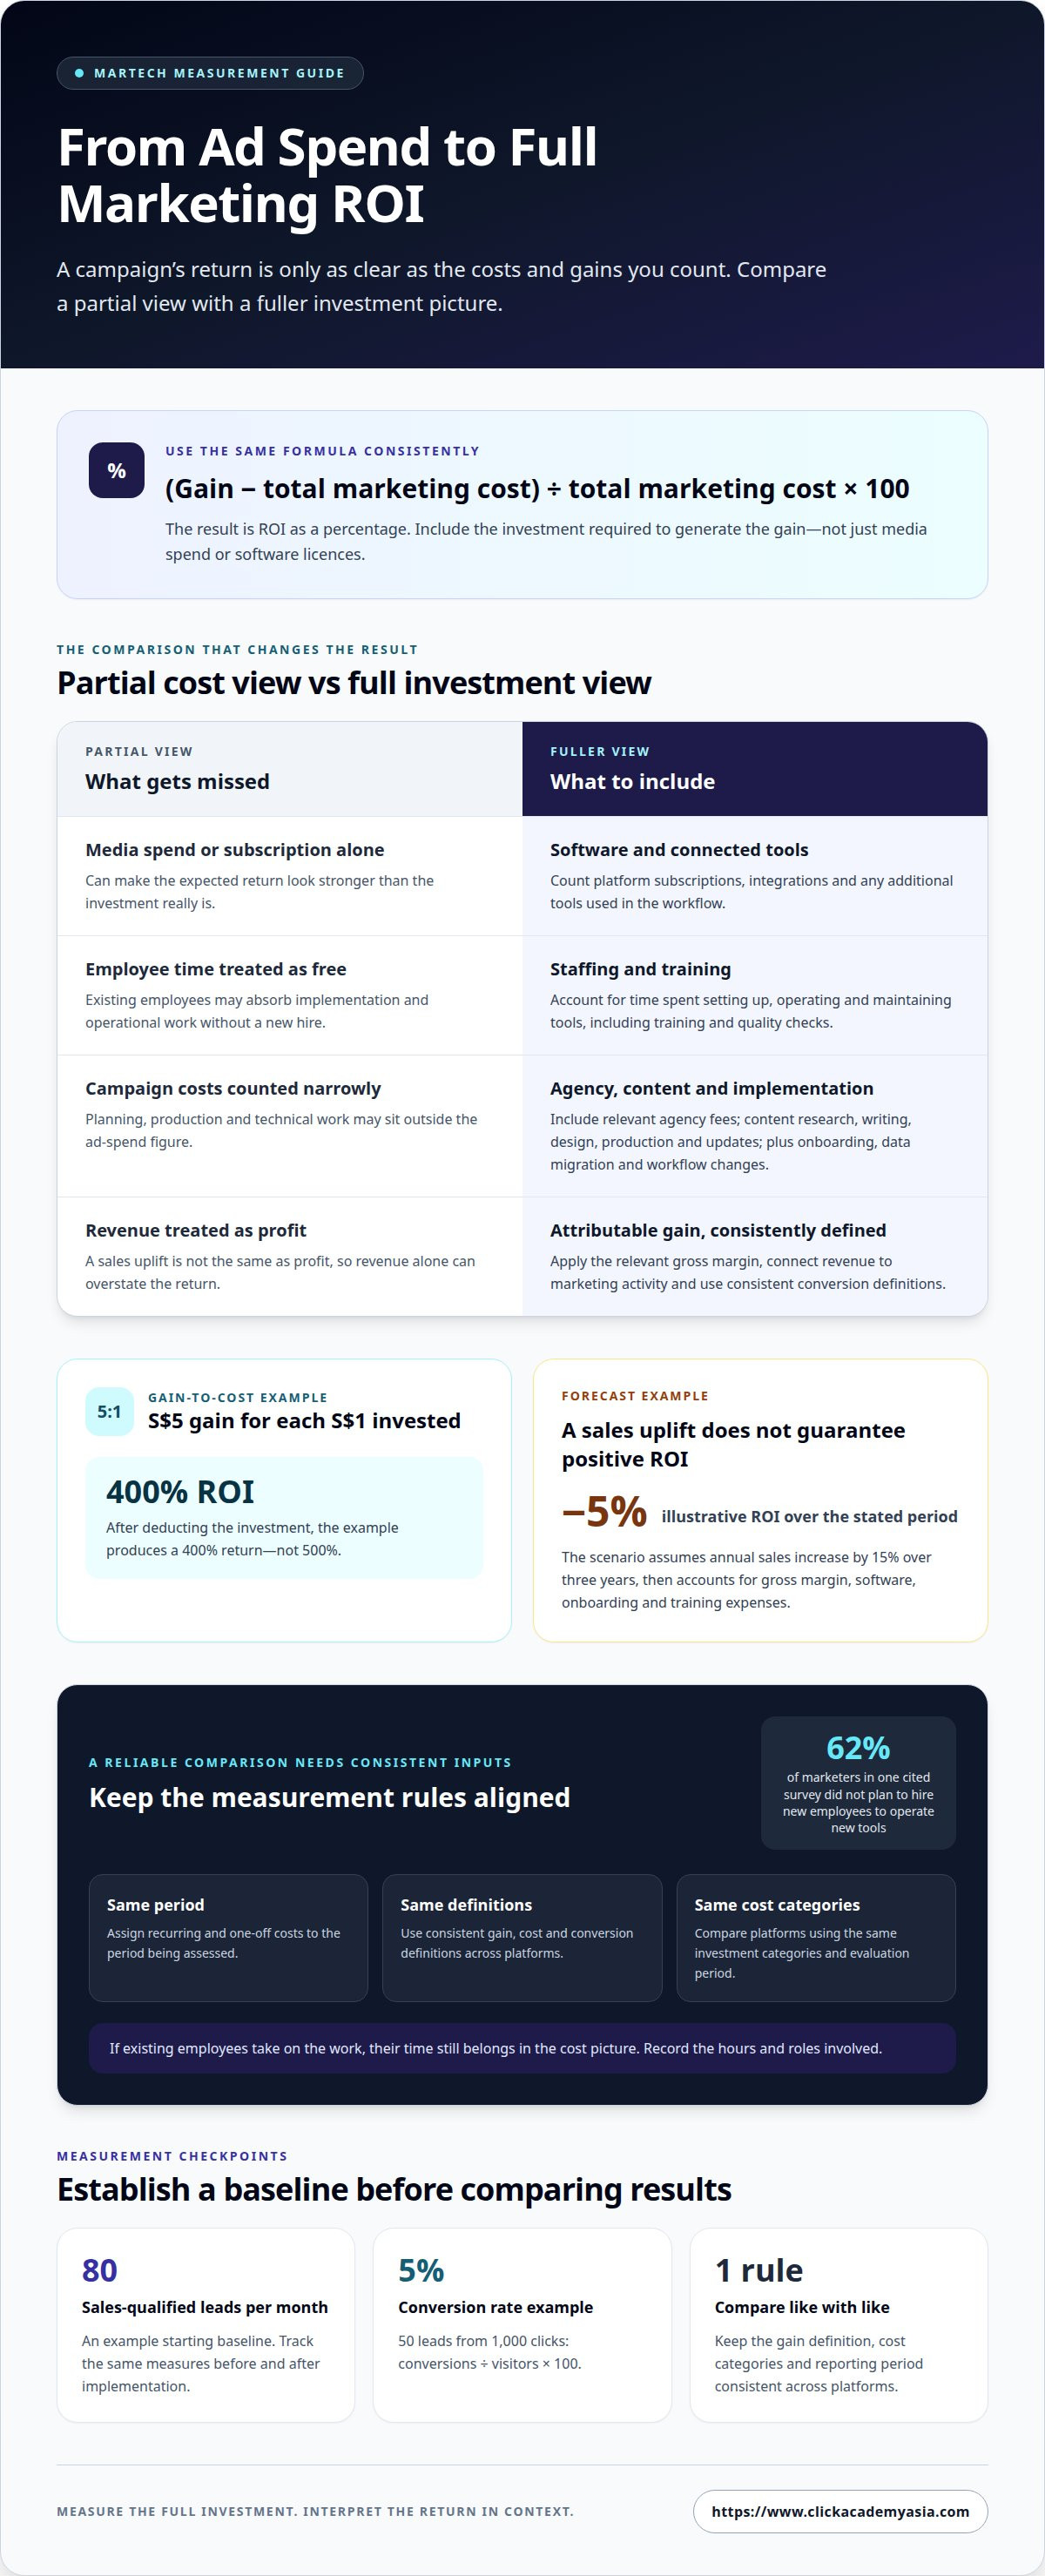
A strong sales result can still hide a weak return if you count ad spend but leave out the rest of the investment. When calculating MarTech ROI, subtract total marketing costs from the gain, divide the result by total marketing costs, then multiply by 100 to express the return as a percentage. Include the costs tied to the campaign, such as software, staffing, content, onboarding and training.
It’s easy to focus on campaign revenue, especially when digital advertising reports clicks and conversions. But those figures tell only part of the story: results depend on which sales you attribute to the campaign, what customers are worth over time, and what it took to generate those outcomes.
This guide explains how to calculate marketing ROI, account for costs and customer value, and interpret attribution across channels. It also shows how to assess digital advertising without mistaking return on ad spend for the full return on your marketing investment.
Table of Contents
Including software, staffing, agency and content costs
A MarTech platform’s subscription fee is only one part of its financial impact. To estimate whether an investment can generate profitable revenue, include the people, services and operational work needed to put the technology to use. A forecast that counts only advertising spend or software licences can overstate the expected return.
Map the full costs of a campaign or implementation. Include recurring expenses and one-off setup work, then assign each cost to the period you’re assessing. This gives you a clear basis for comparing expected gains with the investment required to achieve them.
Software: Include platform subscriptions, integrations and any additional tools needed to run the workflow.
Staffing: Account for employees’ time spent setting up, operating and maintaining the technology. Include time spent on training and quality checks.
Agency support: Add campaign planning, creative, technical implementation and ongoing management fees connected to the work.
Content: Include research, writing, design, production, editing and updates for campaign assets.
Implementation: Record onboarding, data migration, workflow changes and integration work as costs incurred to get the system operating.
Operational costs continue after launch. A team may need to maintain audience data, review automated outputs and troubleshoot connections between tools. These activities use staff capacity even when there’s no separate invoice. Record the hours involved and the roles responsible, so the forecast reflects the work rather than treating it as cost-free.
Staffing assumptions deserve particular attention. One cited survey found that 62% of marketers did not plan to hire new employees to operate new tools. That does not mean implementation requires no labour. If existing employees absorb the work, their time still belongs in the cost picture.
Forecast the full investment against expected revenue
Separate estimated costs from projected gains before calculating return. A MarTech forecast may assume annual sales increase by 15% over three years, but a sales uplift is not the same as profit. Apply the relevant gross margin, then subtract software, onboarding and training expenses. In one illustrative scenario, that fuller calculation produced a -5% ROI over the stated period.
Use a forecast table with a row for each period and separate columns for revenue, software, staffing, agency, content and implementation. Label each figure as a forecast or actual result. This makes it easier to see which assumptions drive the outcome and revise them when actual costs or sales differ.
Finally, compare expected benefits with the total financial and operational investment. Keep recurring platform costs separate from setup costs, and avoid counting the same staff time under both implementation and ongoing operations. This helps decision-makers assess the technology’s contribution without overlooking the effort required to make it work.
How do you calculate marketing ROI?
Use one formula consistently: subtract marketing cost from the gain, divide by cost, then multiply by 100. The result expresses return as a percentage, but its usefulness depends on reliable performance data and a fair comparison period.
Marketing ROI Formulas and Percentages
Marketing ROI measures the gain from an investment after its cost is deducted, expressed as a percentage of that cost. Write it as ((gain − cost) ÷ cost) × 100. For example, a 5:1 gain-to-cost ratio means S$5 of gain for each S$1 invested, producing 400% ROI after deducting the investment. This helps distinguish net return from gross revenue.
For MarTech, define gains and costs consistently across platforms. Include attributable financial gains and the investment required to produce them. A common mistake is treating revenue as profit or counting only media spend, both of which can overstate ROI.
Establishing Baselines and Measuring Performance
A baseline is the measured performance before a tool or campaign changes the process; it gives later results a comparison point. Capture relevant measures, such as qualified leads, conversion rate and sales, before implementation. One example uses 80 sales-qualified leads per month as the starting level. Then record the same measures after launch, using consistent definitions and reporting periods.
Conversion rate is conversions divided by visitors, multiplied by 100. For example, 50 leads from 1,000 clicks equals a 5% conversion rate. A clear baseline helps separate genuine change from seasonal movement or unrelated sales activity.
Comparing MarTech Platform ROI
To compare platforms fairly, use the same evaluation period, gain definition and cost categories for each. Calculate ROI using the same formula, then compare the percentage alongside operational effects such as time saved or workflow changes. This prevents a platform from appearing stronger simply because it uses different reporting assumptions.
Also compare the quality of the measurement behind each result. Check whether revenue can be connected to the relevant marketing activity and whether conversion events are defined consistently. A platform’s headline return alone doesn’t show whether its reported gains are comparable.
Typical ROI and Payback by Tool Category
There isn’t one payback period that applies to every MarTech category; the outcome depends on the tool’s purpose, sales cycle and value created. As reference points, a one-month payback is described as great for B2C, six months for B2B SMBs, and 12 months for B2B enterprises. These are business-model benchmarks, not category-specific guarantees.
Use the measure that matches the tool. Advertising may be assessed through attributable revenue, while automation can also affect staff time and process efficiency. For long-term work, a 30-day view can undervalue content marketing and SEO; compare 30-, 90- and 180-day horizons where relevant.
Make the comparison decision-ready by documenting assumptions, attribution rules and measurement windows alongside each result. This makes it easier to explain platform performance and identify the next test. Teams strengthening their measurement approach can explore marketing analytics skills [Internal Link: ClickAcademy Asia Marketing Analytics & Insights] alongside their ROI review.
Customer lifetime value and acquisition cost
A new customer’s first purchase rarely captures the full value of the relationship. To calculate marketing ROI, compare the cost of acquiring that customer with the value they contribute over time. This shifts the focus from an isolated conversion to the quality and durability of the customer relationship.
Customer lifetime value (LTV) estimates the value a customer contributes throughout their relationship with a business. A useful estimate considers repeat purchases, retained revenue and the costs of serving that customer. Revenue alone can overstate value: a frequent buyer may also require substantial service or discounts. Use a consistent period and calculation method when comparing customer groups.
Customer acquisition cost (CAC) is the marketing and sales investment divided by the number of new customers acquired. Include the costs of the campaigns and activities that generated those customers, not just the final click or lead source. If a campaign produces leads but few become customers, lead volume alone won’t show whether acquisition is efficient.
Consider a PPC example where 10 leads convert into customers. Their average sale value is one input, but it isn’t automatically their lifetime value. To assess the relationship, examine repeat purchases, retention and service costs, then compare the resulting customer value with the investment needed to acquire those customers.
The LTV:CAC ratio places these measures side by side. A ratio of 3:1 or higher is typically described as healthy. In practical terms, the estimated customer value is at least three times the acquisition cost. Treat this as a guide rather than a standalone verdict: margin, retention, sales-cycle length and the reliability of customer data all affect what the ratio means for a business.
Use customer cohorts to make the comparison more useful. Group customers by a shared acquisition period or campaign, then track purchases and retention using the same definitions. This helps distinguish a cohort with strong initial sales from one that continues to contribute value. It also makes campaign comparisons fairer when customers take different paths from first interaction to purchase.
Check the value measure: Separate sales revenue from the contribution that remains after serving customers.
Check acquisition scope: Include the relevant marketing and sales effort behind new customers.
Check the cohort: Compare customers acquired through similar campaigns and periods.
Check the time horizon: Allow repeat-purchase and retention patterns to emerge before judging long-term value.
These measures make ROI more customer-centred. They show whether marketing attracts buyers who continue to contribute, rather than rewarding campaigns solely for generating leads or first purchases.
Data silos and cross-channel attribution
In Singapore, GST, local vendor pricing and data privacy considerations affect different parts of MarTech ROI. Model GST according to your organisation’s finance treatment, record vendor charges in S$, and include the operational work required to use customer data responsibly for attribution.
Data silos form when platforms hold separate records that don’t connect customer interactions. An ad platform may record a click, an email system a response, and a sales system a purchase. Analysing each platform alone can credit several channels for the same outcome or miss earlier interactions that influenced the sale.
For a multi-channel campaign, combine channel revenue and costs, then apply an attribution model to assign revenue across channels. First, agree on the campaign period and what counts as a conversion. Next, connect available records using consistent campaign identifiers, such as UTM tags, and compare touchpoints with sales outcomes. Keep unmatched or duplicated records visible instead of treating the data as complete.
First-touch attribution assigns credit to the first recorded interaction, highlighting discovery channels.
Last-touch attribution credits the final interaction before conversion, showing what preceded the purchase.
Multi-touch attribution distributes credit across recorded interactions, reflecting several influences in a customer journey.
Each model answers a different analysis question. If a Singapore retailer uses paid search, email and social media before a purchase, last-touch may credit search, while first-touch credits social media. Multi-touch can show both roles, but the result depends on the interactions captured and the credit rules selected. Use the same model to compare campaigns, and state it alongside the reported ROI.
GST and local vendor pricing also affect whether comparisons are like-for-like. Record vendor invoices in S$, separate GST as a distinct line, and use the finance treatment relevant to your organisation’s calculation. For example, comparing a local supplier’s quoted amount with a platform charge in another currency requires consistent currency conversion and clear treatment of fees. Document the exchange rate, invoice period and tax treatment with the analysis.
Privacy considerations shape which customer records can be joined and how teams manage them. Build data-handling work into the measurement plan, including access controls, retention processes and reviews of permitted uses. If identifiable records can’t be used for a particular analysis, aggregate reporting may still reveal channel patterns without linking every interaction to an individual.
Finally, report confidence alongside the attribution result. Note the channels included, the period measured, missing data and the model selected. This context helps decision-makers distinguish measured contribution from assumption, especially when a campaign spans several platforms and a longer sales journey.
Which revenue and efficiency benefits can be attributed to MarTech?
MarTech can influence revenue and productivity, but include a benefit in your calculating martech roi framework only when evidence connects it to the technology. Separate observed outcomes from assumptions. For example, a rise in email sales after a campaign matters, but compare it with the previous baseline and account for other changes before assigning credit.
Email marketing has an average return on investment of 3,800%. Treat this as a broad benchmark, not a forecast for an individual campaign. Your own result depends on audience quality, message relevance, conversion behaviour and the full cost of producing and sending each email.
Assess benefits in distinct categories so you don’t count the same outcome twice:
Revenue contribution: Track sales connected to campaign interactions, then apply a consistent attribution approach.
Conversion improvement: Compare conversion rates before and after a change, while checking for other campaign or market shifts.
Time saved: Record task time before and after automation, such as drafting, segmentation or reporting.
Capacity released: Identify whether saved hours support more campaign work, faster analysis or other valuable tasks.
Generative AI marketing tools are associated with a 20-50% reduction in time on specific tasks. Measure the task itself, rather than assuming every saved hour becomes financial value. For instance, compare drafting time for similar campaign assets, then document whether the team used the recovered capacity productively. This separates efficiency evidence from a cash saving.
Industry leaders are seeing 20-30% higher campaign ROI with AI. That figure describes reported campaign outcomes, not a guaranteed result for every team. To evaluate your own performance, record the campaign objective, comparison period, technology used and related costs. Check whether the change coincided with new creative, audience targeting or budget shifts. Those factors can also affect results.
Build an evidence trail for each claimed benefit. Link revenue to identifiable campaigns, record time saved against a defined task, and note assumptions used to value efficiency. Keep revenue gains separate from productivity gains until the analysis shows how each contributes. This prevents the same improvement from appearing as both additional revenue and labour savings.
For content teams, applying structured ClickAcademy Asia Content Marketing Strategy practices can help connect production activity with audience and business outcomes. To further enhance your analytical capabilities, exploring ClickAcademy Asia Marketing Analytics & Insights provides deeper context on measuring performance accurately. Additionally, aligning these metrics with a broader ClickAcademy Asia WSQ Digital Marketing Strategy & Planning approach ensures your technology investments directly support overall business goals.
ClickAcademy Asia: WSQ Digital Marketing Strategy & Planning
ClickAcademy Asia offers WSQ Digital Marketing Strategy & Planning for professionals who need to connect marketing activity with business objectives. It’s a useful next step when ROI analysis reveals gaps in campaign planning, channel selection or performance measurement.
Build a strategic foundation to set clearer objectives, align digital activity with intended outcomes and make informed marketing decisions. For teams focused on specific channels, WSQ Content Marketing Strategy, WSQ Search Engine Optimization (SEO) and WSQ Search Engine Marketing (SEM) can develop complementary capabilities.
Stronger planning helps teams define what success means before campaigns begin, then assess results against that purpose. To discuss learning options, contact ClickAcademy Asia.
Turn measurement into a stronger marketing practice
Make the next step a team decision: identify a capability gap and connect it to a business priority. A disciplined approach to calculating MarTech ROI can help teams turn campaign results into clearer choices about where to focus and which skills to build.
Equip your team through WSQ-funded training tracks, including WSQ Digital Marketing Strategy & Planning, WSQ Content Marketing Strategy and WSQ Search Engine Optimization (SEO). Explore the relevant learning options here [Internal Link: ClickAcademy Asia WSQ Digital Marketing Strategy & Planning].
With stronger capabilities, your team can make marketing decisions with greater confidence and rigour. Keep building practical skills and make measurement part of how your organisation learns and improves.
Frequently Asked Questions
So, Is Calculating MarTech ROI Impossible?
No. Calculating MarTech ROI is practical when teams define the outcome, costs and measurement period consistently. Perfect attribution isn’t required to make a useful decision. For example, compare campaign results using the same sales definition and attribution approach, then record gaps such as untracked offline interactions. Clear assumptions make estimates easier to interpret and improve, even when customer journeys cross multiple platforms.
What Is Marketing ROI and Why Is It Crucial?
Marketing ROI shows how the financial gain from marketing compares with the investment required to produce it. It helps leaders decide whether to continue, adjust or pause an activity. A campaign, for example, may generate strong traffic but few qualified sales. Reviewing its return alongside lead quality helps distinguish audience attention from business value and supports better-informed budget decisions.
What techniques can enhance the ROI of marketing campaigns?
Improve campaign ROI by aligning each activity with a defined business objective, then testing one meaningful change at a time. A team could compare two audience segments or creative approaches while keeping other campaign conditions stable. Review lead quality as well as volume, then use results to refine targeting, messaging and the landing-page experience. This makes optimisation repeatable rather than a series of guesses.
What tools are useful for tracking marketing ROI?
Use an analytics platform to monitor visits and conversions, an advertising platform to manage campaign delivery, and a CRM to connect leads with sales outcomes. A finance spreadsheet can consolidate costs and results across channels. Consistent campaign tags, for example, help link an email response or paid search click to later CRM activity. The right toolset connects reliable data across the customer journey.
Which metrics are critical for measuring marketing ROI?
Choose metrics that connect campaign activity with commercial results. Useful measures include conversion rate, customer acquisition cost, customer lifetime value, attributed revenue and gross margin. For efficiency-focused MarTech, also monitor task time and workflow adoption. A campaign may attract leads efficiently but underperform on sales conversion, so reviewing both stages reveals where improvement is needed.
Why is marketing ROI important?
Marketing ROI helps organisations make evidence-led decisions about budgets, channels and team capacity. Without it, high click or engagement counts can look successful despite contributing little to sales. Comparing campaign returns alongside customer quality, for example, can reveal which activities support sustainable growth. It also gives marketing and finance teams a shared basis for discussing investment priorities and future performance.
How do you calculate marketing technology (MarTech) ROI?
Subtract the total investment from the gain linked to the MarTech, divide that result by the investment, then multiply by 100 for a percentage. Use financial gain rather than assuming every revenue increase is profit. For a fair assessment, define which outcomes the technology influenced and apply the same calculation period to both gains and costs. Document assumptions so another team member can reproduce the result.
What costs should be included in a MarTech ROI calculation?
Include more than the platform subscription. Account for implementation, integrations, employee time, training, agency support, content production and ongoing maintenance. A new automation tool, for example, may require staff to clean data and review outputs before campaigns run. Include those operational tasks in the relevant period, even if they don’t appear as separate invoices. This gives decision-makers a more complete view of the investment.



Comments